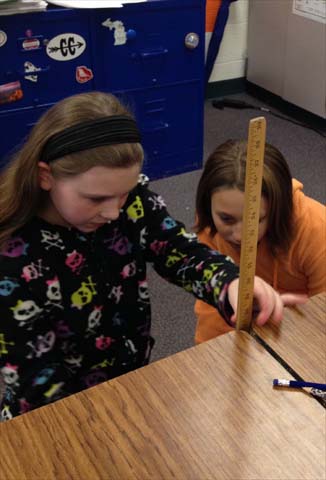
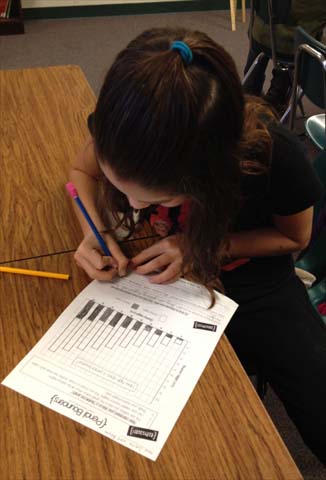
We learned that when you
bounce the pencil it goes higher when you drop the pencil from a
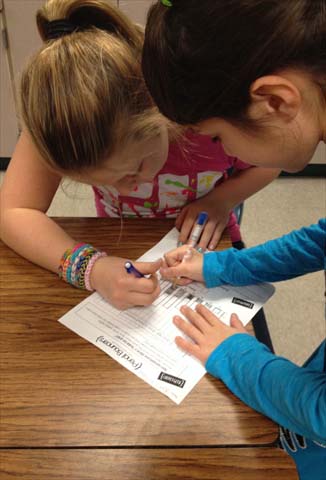
higher height. First we collected data for each height and
found the median and then represented the data on a bar graph.
Bouncing pencils is fun and hard at the same time.
~from Lexi and Baylee
|
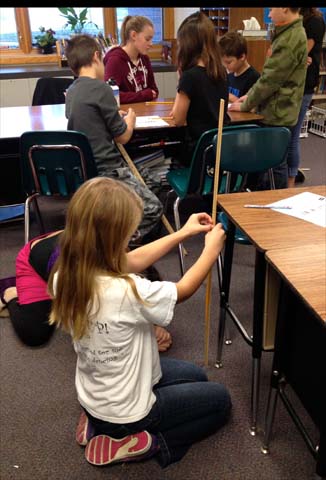
We gathered data from bouncing a
pencil. We bounced the pencil three times at different heights. We
started at 10 cm, and bounced the pencil three times. We found the
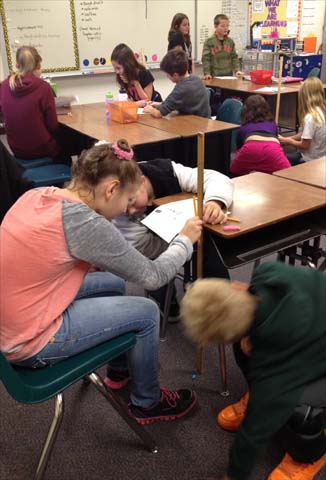
median height that the pencil bounced at each height. Then we collected
median data on a bar graph The bar graph showed that each time we
bounced at a different height the pencil bounced higher than the
previous drop. We learned as you bounce the pencil at higher height the
pencil bounced higher. ~from Hayden and Cyerah |